Note
Click here to download the full example code
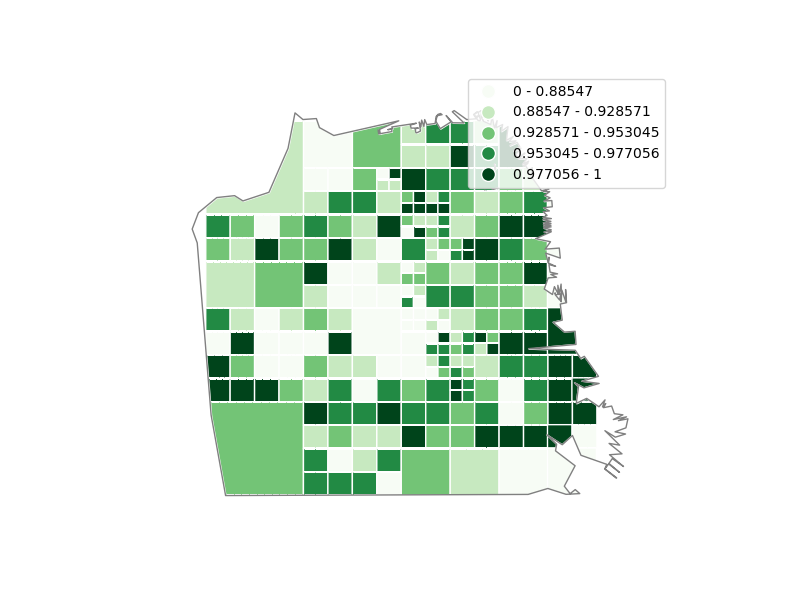
Quadtree of San Francisco street trees
This example shows the geospatial nullity pattern (whether records are more or less likely to be null in one region versus another) of a dataset on city-maintained street trees by species in San Francisco.
In this case we see that there is small but significant amount of variation in the percentage of trees classified per area, which ranges from 88% to 98%.
For more tools for visualizing data nullity, check out the ``missingno` library <https://github.com/ResidentMario/missingno>`_.
Out:
/Users/alekseybilogur/opt/miniconda3/envs/geoplot-dev/lib/python3.8/site-packages/geopandas/geoseries.py:644: UserWarning: GeoSeries.isna() previously returned True for both missing (None) and empty geometries. Now, it only returns True for missing values. Since the calling GeoSeries contains empty geometries, the result has changed compared to previous versions of GeoPandas.
Given a GeoSeries 's', you can use 's.is_empty | s.isna()' to get back the old behaviour.

To further ignore this warning, you can do:
import warnings; warnings.filterwarnings('ignore', 'GeoSeries.isna', UserWarning)
  return self.isna()

<GeoAxesSubplot:>
import geopandas as gpd
import geoplot as gplt
import geoplot.crs as gcrs


trees = gpd.read_file(gplt.datasets.get_path('san_francisco_street_trees_sample'))
sf = gpd.read_file(gplt.datasets.get_path('san_francisco'))


ax = gplt.quadtree(
    trees.assign(nullity=trees['Species'].notnull().astype(int)),
    projection=gcrs.AlbersEqualArea(),
    hue='nullity', nmax=1, cmap='Greens', scheme='Quantiles', legend=True,
    clip=sf, edgecolor='white', linewidth=1
)
gplt.polyplot(sf, facecolor='None', edgecolor='gray', linewidth=1, zorder=2, ax=ax)
Total running time of the script: ( 0 minutes 7.568 seconds)