Note
Click here to download the full example code
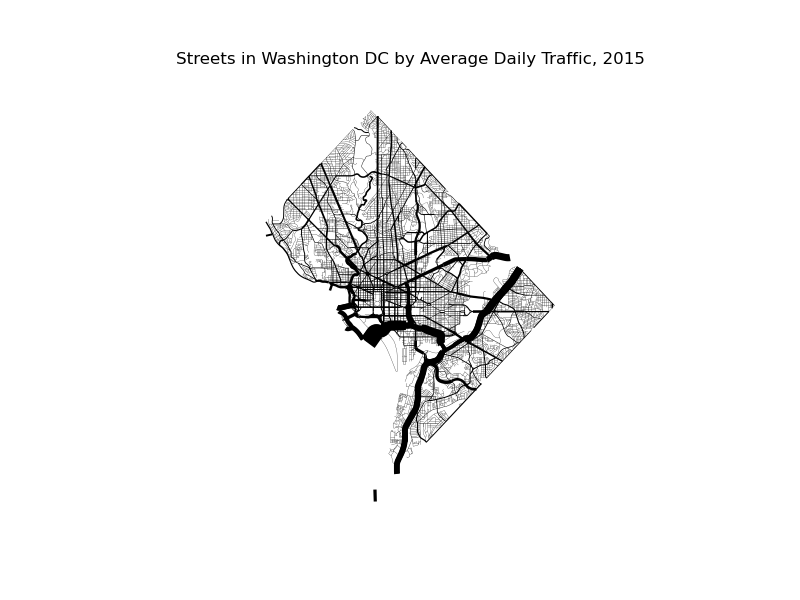
Sankey of traffic volumes in Washington DC
This example plots annual average daily traffic volume in Washington DC.
Out:
Text(0.5, 1.0, 'Streets in Washington DC by Average Daily Traffic, 2015')
import geopandas as gpd
import geoplot as gplt
import geoplot.crs as gcrs
import matplotlib.pyplot as plt

dc_roads = gpd.read_file(gplt.datasets.get_path('dc_roads'))

gplt.sankey(
    dc_roads, projection=gcrs.AlbersEqualArea(),
    scale='aadt', limits=(0.1, 10), color='black'
)

plt.title("Streets in Washington DC by Average Daily Traffic, 2015")
Total running time of the script: ( 0 minutes 9.184 seconds)