Note
Click here to download the full example code
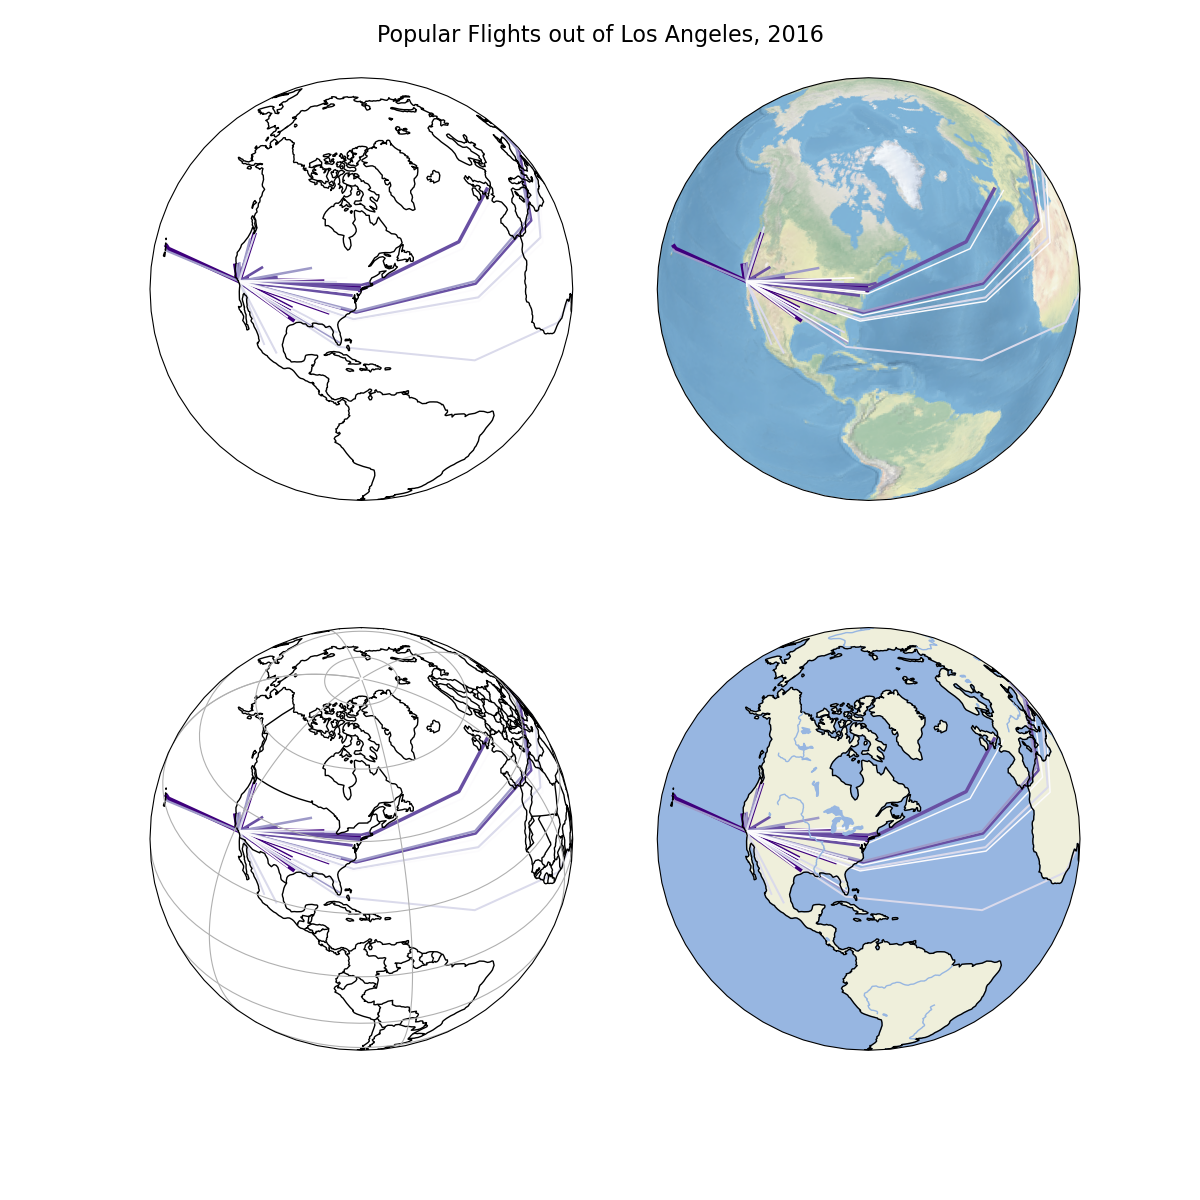
Sankey of Los Angeles flight volumes with Cartopy globes
This example plots passenger volumes for commercial flights out of Los Angeles International
Airport. Some globe-modification options available in cartopy are demonstrated. Visit
the cartopy docs
for more information.
Out:
/Users/alekseybilogur/Desktop/geoplot/examples/plot_los_angeles_flights.py:31: DeprecationWarning: The outline_patch property is deprecated. Use GeoAxes.spines['geo'] or the default Axes properties instead.
  ax.outline_patch.set_visible(True)
/Users/alekseybilogur/Desktop/geoplot/examples/plot_los_angeles_flights.py:38: DeprecationWarning: The outline_patch property is deprecated. Use GeoAxes.spines['geo'] or the default Axes properties instead.
  ax.outline_patch.set_visible(True)
/Users/alekseybilogur/Desktop/geoplot/examples/plot_los_angeles_flights.py:45: DeprecationWarning: The outline_patch property is deprecated. Use GeoAxes.spines['geo'] or the default Axes properties instead.
  ax.outline_patch.set_visible(True)
/Users/alekseybilogur/Desktop/geoplot/examples/plot_los_angeles_flights.py:54: DeprecationWarning: The outline_patch property is deprecated. Use GeoAxes.spines['geo'] or the default Axes properties instead.
  ax.outline_patch.set_visible(True)

<cartopy.mpl.feature_artist.FeatureArtist object at 0x7fe3047659d0>
import geopandas as gpd
import geoplot as gplt
import geoplot.crs as gcrs
import matplotlib.pyplot as plt
import cartopy
import mapclassify as mc

la_flights = gpd.read_file(gplt.datasets.get_path('la_flights'))
scheme = mc.Quantiles(la_flights['Passengers'], k=5)

f, axarr = plt.subplots(2, 2, figsize=(12, 12), subplot_kw={
    'projection': gcrs.Orthographic(central_latitude=40.7128, central_longitude=-74.0059)
})
plt.suptitle('Popular Flights out of Los Angeles, 2016', fontsize=16)
plt.subplots_adjust(top=0.95)

ax = gplt.sankey(
    la_flights, scale='Passengers', hue='Passengers', cmap='Purples', scheme=scheme, ax=axarr[0][0]
)
ax.set_global()
ax.outline_patch.set_visible(True)
ax.coastlines()

ax = gplt.sankey(
    la_flights, scale='Passengers', hue='Passengers', cmap='Purples', scheme=scheme, ax=axarr[0][1]
)
ax.set_global()
ax.outline_patch.set_visible(True)
ax.stock_img()

ax = gplt.sankey(
    la_flights, scale='Passengers', hue='Passengers', cmap='Purples', scheme=scheme, ax=axarr[1][0]
)
ax.set_global()
ax.outline_patch.set_visible(True)
ax.gridlines()
ax.coastlines()
ax.add_feature(cartopy.feature.BORDERS)

ax = gplt.sankey(
    la_flights, scale='Passengers', hue='Passengers', cmap='Purples', scheme=scheme, ax=axarr[1][1]
)
ax.set_global()
ax.outline_patch.set_visible(True)
ax.coastlines()
ax.add_feature(cartopy.feature.LAND)
ax.add_feature(cartopy.feature.OCEAN)
ax.add_feature(cartopy.feature.LAKES)
ax.add_feature(cartopy.feature.RIVERS)
Total running time of the script: ( 0 minutes 2.370 seconds)