Note
Click here to download the full example code
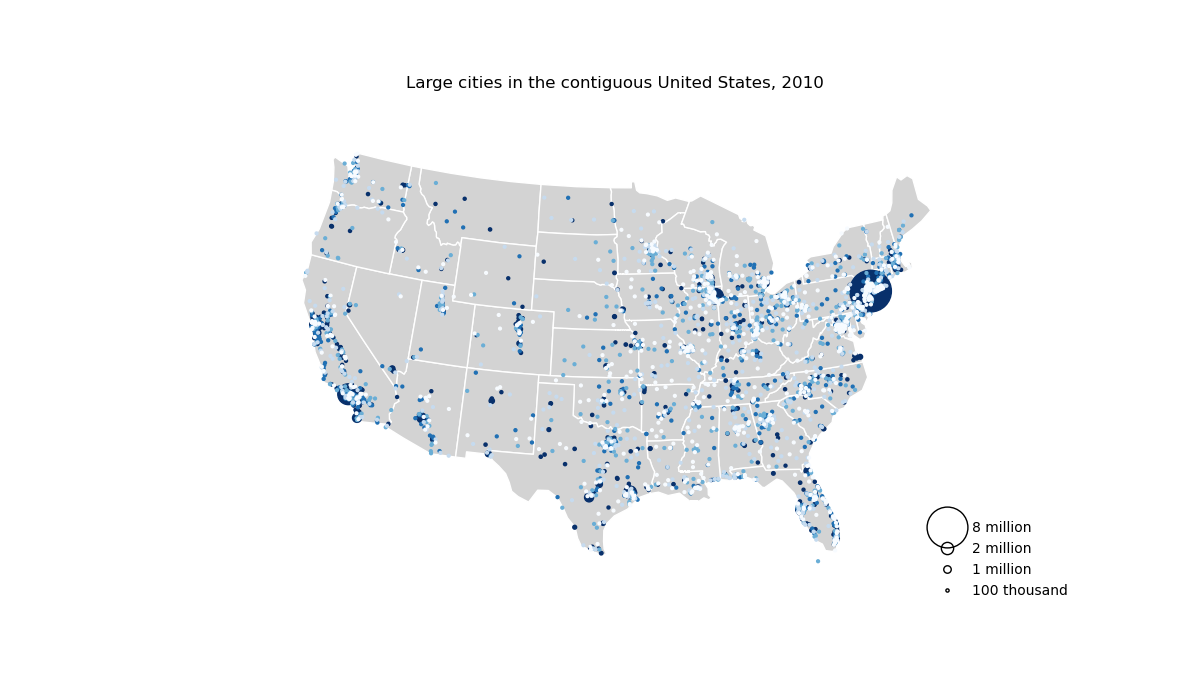
Pointplot of US cities by population
This example, taken from the User Guide, plots cities in the contiguous United States by their
population. It demonstrates some of the range of styling options available in geoplot.
Out:
Text(0.5, 1.0, 'Large cities in the contiguous United States, 2010')
import geopandas as gpd
import geoplot as gplt
import geoplot.crs as gcrs
import matplotlib.pyplot as plt
import mapclassify as mc

continental_usa_cities = gpd.read_file(gplt.datasets.get_path('usa_cities'))
continental_usa_cities = continental_usa_cities.query('STATE not in ["AK", "HI", "PR"]')
contiguous_usa = gpd.read_file(gplt.datasets.get_path('contiguous_usa'))
scheme = mc.Quantiles(continental_usa_cities['POP_2010'], k=5)

ax = gplt.polyplot(
    contiguous_usa,
    zorder=-1,
    linewidth=1,
    projection=gcrs.AlbersEqualArea(),
    edgecolor='white',
    facecolor='lightgray',
    figsize=(12, 7)
)
gplt.pointplot(
    continental_usa_cities,
    scale='POP_2010',
    limits=(2, 30),
    hue='POP_2010',
    cmap='Blues',
    scheme=scheme,
    legend=True,
    legend_var='scale',
    legend_values=[8000000, 2000000, 1000000, 100000],
    legend_labels=['8 million', '2 million', '1 million', '100 thousand'],
    legend_kwargs={'frameon': False, 'loc': 'lower right'},
    ax=ax
)

plt.title("Large cities in the contiguous United States, 2010")
Total running time of the script: ( 0 minutes 1.280 seconds)