Note
Click here to download the full example code
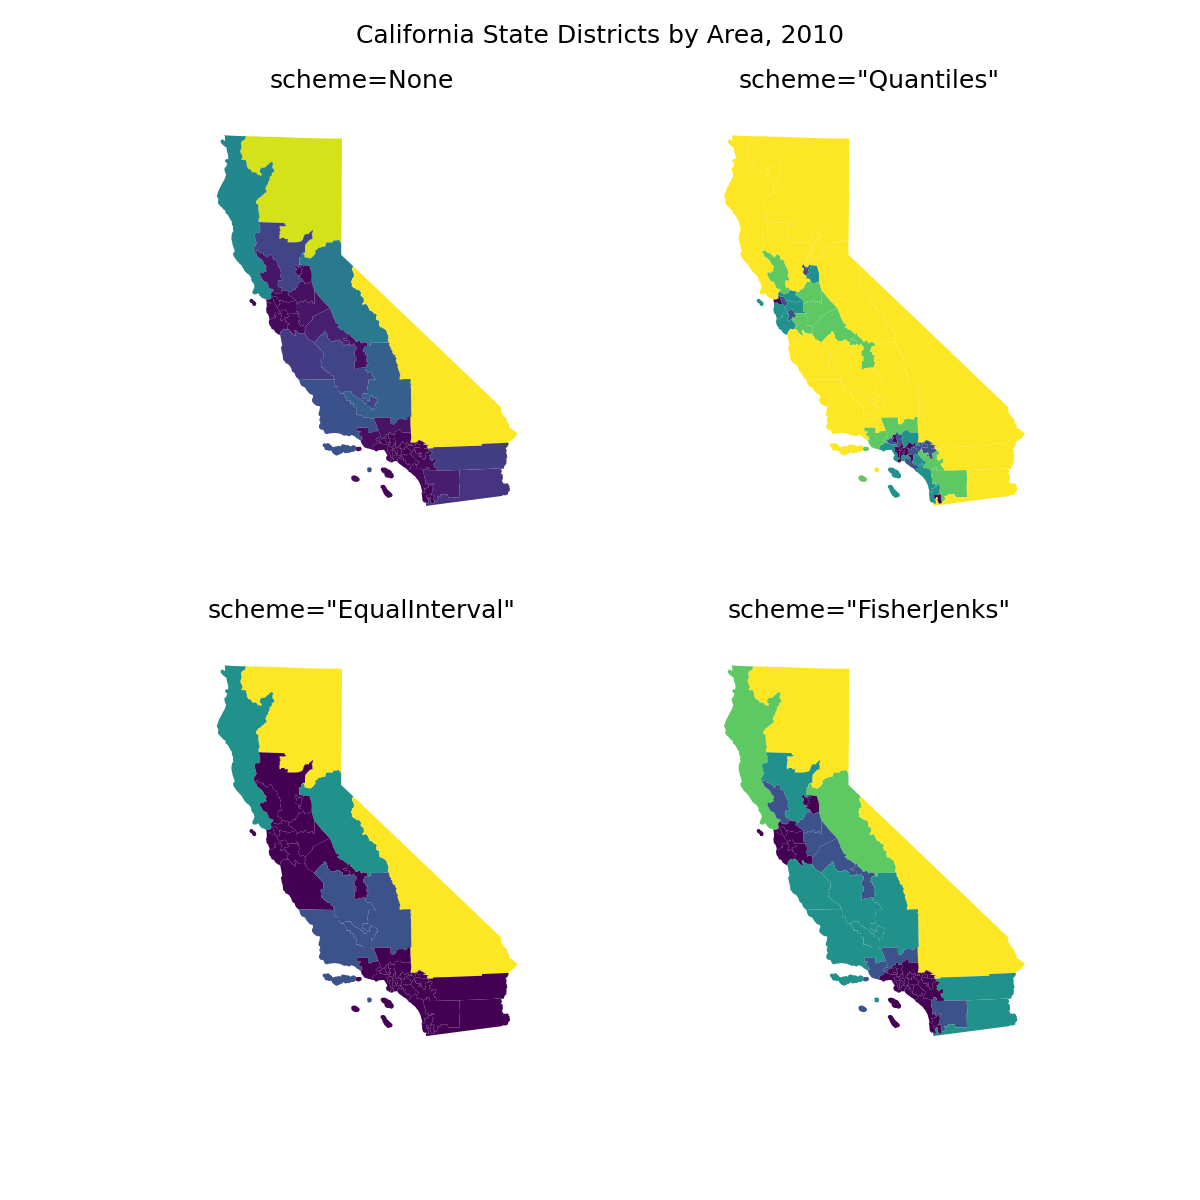
Choropleth of California districts with alternative binning schemes
This example demonstrates the continuous and categorical binning schemes available in geoplot
on a sample dataset of California congressional districts. A binning scheme (or classifier) is a
methodology for splitting a sequence of observations into some number of bins (classes). It is also
possible to have no binning scheme, in which case the data is passed through to cmap as-is.
The options demonstrated are:
scheme=None—A continuous colormap.
scheme=”Quantiles”—Bins the data such that the bins contain equal numbers of samples.
scheme=”EqualInterval”—Bins the data such that bins are of equal length.
scheme=”FisherJenks”—Bins the data using the Fisher natural breaks optimization procedure.
To learn more about colormaps in general, refer to the Hue reference in the documentation.
This demo showcases a small subset of the classifiers available in mapclassify, the library
that geoplot relies on for this feature. To learn more about mapclassify, including how
you can build your own custom UserDefined classifier, refer to the mapclassify docs.
Out:
/Users/alekseybilogur/Desktop/geoplot/examples/plot_california_districts.py:35: UserWarning: Geometry is in a geographic CRS. Results from 'area' are likely incorrect. Use 'GeoSeries.to_crs()' to re-project geometries to a projected CRS before this operation.

  cali = cali.assign(area=cali.geometry.area)
/Users/alekseybilogur/Desktop/geoplot/examples/plot_california_districts.py:46: UserWarning: Geometry is in a geographic CRS. Results from 'area' are likely incorrect. Use 'GeoSeries.to_crs()' to re-project geometries to a projected CRS before this operation.

  scheme = mc.Quantiles(cali.area, k=5)
/Users/alekseybilogur/Desktop/geoplot/examples/plot_california_districts.py:52: UserWarning: Geometry is in a geographic CRS. Results from 'area' are likely incorrect. Use 'GeoSeries.to_crs()' to re-project geometries to a projected CRS before this operation.

  scheme = mc.EqualInterval(cali.area, k=5)
/Users/alekseybilogur/Desktop/geoplot/examples/plot_california_districts.py:58: UserWarning: Geometry is in a geographic CRS. Results from 'area' are likely incorrect. Use 'GeoSeries.to_crs()' to re-project geometries to a projected CRS before this operation.

  scheme = mc.FisherJenks(cali.area, k=5)

Text(0.5, 0.98, 'California State Districts by Area, 2010')
import geopandas as gpd
import geoplot as gplt
import geoplot.crs as gcrs
import mapclassify as mc
import matplotlib.pyplot as plt

cali = gpd.read_file(gplt.datasets.get_path('california_congressional_districts'))
cali = cali.assign(area=cali.geometry.area)


proj = gcrs.AlbersEqualArea(central_latitude=37.16611, central_longitude=-119.44944)
fig, axarr = plt.subplots(2, 2, figsize=(12, 12), subplot_kw={'projection': proj})

gplt.choropleth(
    cali, hue='area', linewidth=0, scheme=None, ax=axarr[0][0]
)
axarr[0][0].set_title('scheme=None', fontsize=18)

scheme = mc.Quantiles(cali.area, k=5)
gplt.choropleth(
    cali, hue='area', linewidth=0, scheme=scheme, ax=axarr[0][1]
)
axarr[0][1].set_title('scheme="Quantiles"', fontsize=18)

scheme = mc.EqualInterval(cali.area, k=5)
gplt.choropleth(
    cali, hue='area', linewidth=0, scheme=scheme, ax=axarr[1][0]
)
axarr[1][0].set_title('scheme="EqualInterval"', fontsize=18)

scheme = mc.FisherJenks(cali.area, k=5)
gplt.choropleth(
    cali, hue='area', linewidth=0, scheme=scheme, ax=axarr[1][1]
)
axarr[1][1].set_title('scheme="FisherJenks"', fontsize=18)

plt.subplots_adjust(top=0.92)
plt.suptitle('California State Districts by Area, 2010', fontsize=18)
Total running time of the script: ( 0 minutes 2.023 seconds)