Note
Click here to download the full example code
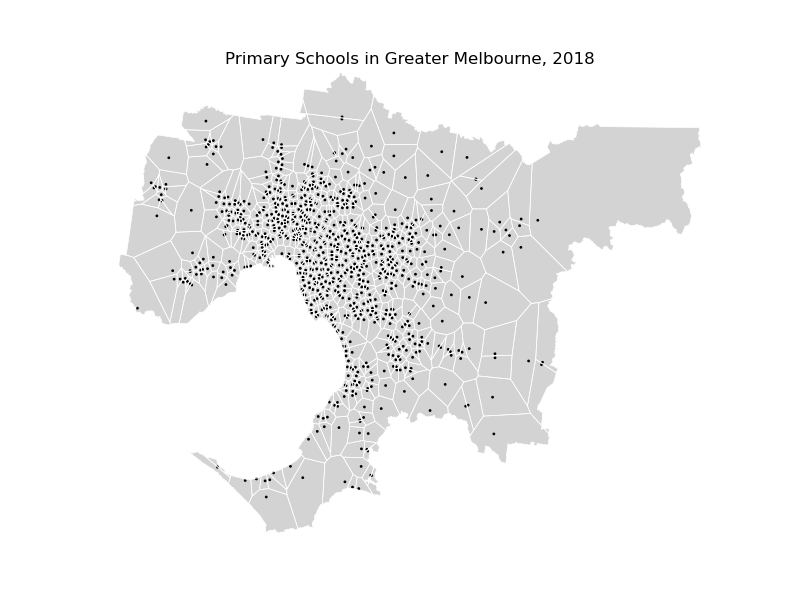
Voronoi of Melbourne primary schools
This example shows a pointplot combined with a voronoi mapping primary schools in
Melbourne. Schools in outlying, less densely populated areas serve larger zones than those in
central Melbourne.
This example inspired by the Melbourne Schools Zones Webmap.
Out:
Text(0.5, 1.0, 'Primary Schools in Greater Melbourne, 2018')
import geopandas as gpd
import geoplot as gplt
import geoplot.crs as gcrs
import matplotlib.pyplot as plt

melbourne = gpd.read_file(gplt.datasets.get_path('melbourne'))
melbourne_primary_schools = gpd.read_file(gplt.datasets.get_path('melbourne_schools'))\
    .query('School_Type == "Primary"')


ax = gplt.voronoi(
    melbourne_primary_schools, clip=melbourne, linewidth=0.5, edgecolor='white',
    projection=gcrs.Mercator()
)
gplt.polyplot(melbourne, edgecolor='None', facecolor='lightgray', ax=ax)
gplt.pointplot(melbourne_primary_schools, color='black', ax=ax, s=1, extent=melbourne.total_bounds)
plt.title('Primary Schools in Greater Melbourne, 2018')
Total running time of the script: ( 0 minutes 5.831 seconds)