Note
Click here to download the full example code
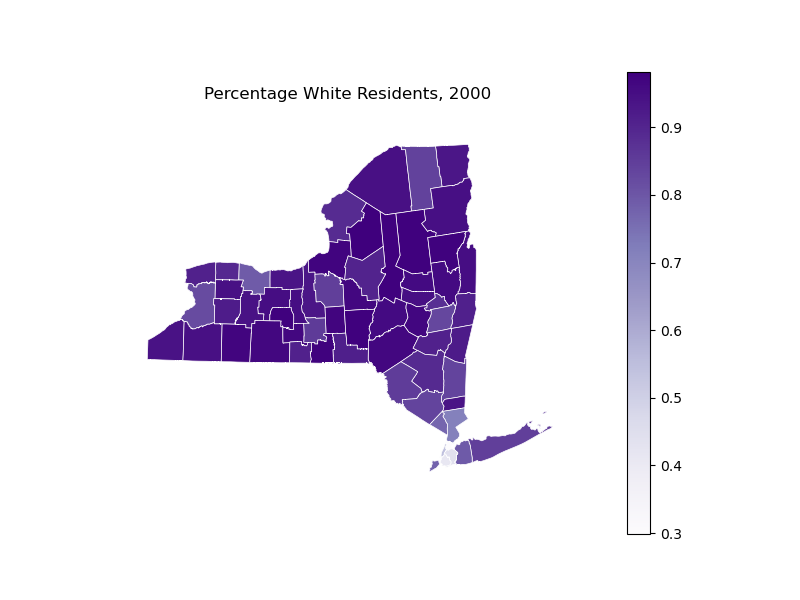
Choropleth of New York State population demographics
This example plots the percentage of residents in New York State by county who self-identified as “white” in the 2000 census. New York City is far more ethnically diversity than the rest of the state.
Out:
Text(0.5, 1.0, 'Percentage White Residents, 2000')
import geopandas as gpd
import geoplot as gplt
import geoplot.crs as gcrs
import matplotlib.pyplot as plt

ny_census_tracts = gpd.read_file(gplt.datasets.get_path('ny_census'))
ny_census_tracts = ny_census_tracts.assign(
    percent_white=ny_census_tracts['WHITE'] / ny_census_tracts['POP2000']
)

gplt.choropleth(
    ny_census_tracts,
    hue='percent_white',
    cmap='Purples', linewidth=0.5,
    edgecolor='white',
    legend=True,
    projection=gcrs.AlbersEqualArea()
)
plt.title("Percentage White Residents, 2000")
Total running time of the script: ( 0 minutes 0.666 seconds)