geoplot: geospatial data visualization
======================================
.. raw:: html
``geoplot`` is a high-level Python geospatial plotting library. It's an extension to ``cartopy`` and ``matplotlib``
which makes mapping easy: like ``seaborn`` for geospatial. It comes with the following features:
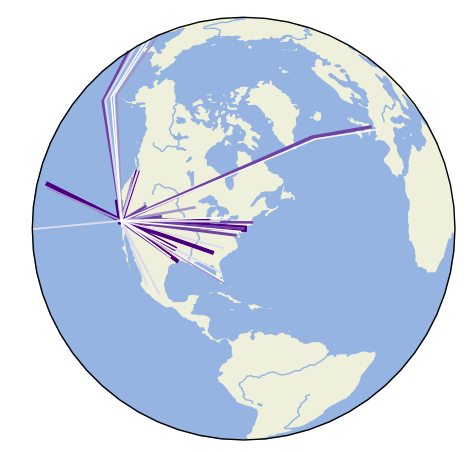
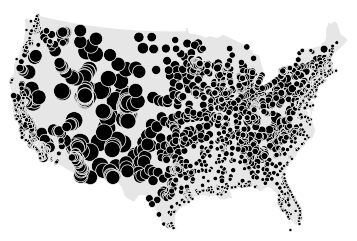
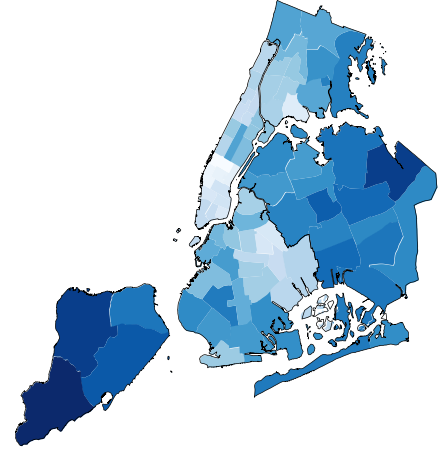
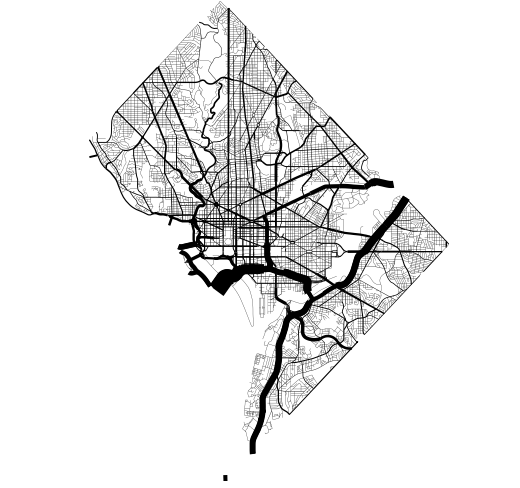
* **High-level plotting API**: ``geoplot`` is cartographic plotting for the 90% of use cases. All of the standard-bearermaps that you’ve probably seen in your geography textbook are easily accessible.
* **Native projection support**: The most fundamental peculiarity of geospatial plotting is projection: how do you unroll a sphere onto a flat surface (a map) in an accurate way? The answer depends on what you’re trying to depict. ``geoplot`` provides these options.
* **Compatibility with Matplotlib**: While ``matplotlib`` is not a good fit for working with geospatial data directly, it’s a format that’s well-incorporated by other tools.
For a brief introduction refer to the `Quickstart`_.
.. _Quickstart: quickstart/Quickstart.ipynb
.. toctree::
:maxdepth: 1
:caption: Getting Started
installation.rst
quickstart/quickstart.ipynb
.. toctree::
:maxdepth: 1
:caption: User Guide
user_guide/Working_with_Geospatial_Data.ipynb
user_guide/Working_with_Projections.ipynb
user_guide/Customizing_Plots.ipynb
plot_references/plot_reference.rst
.. toctree::
:maxdepth: 1
:caption: Gallery
Gallery
.. toctree::
:maxdepth: 1
:caption: API Reference
api_reference.rst